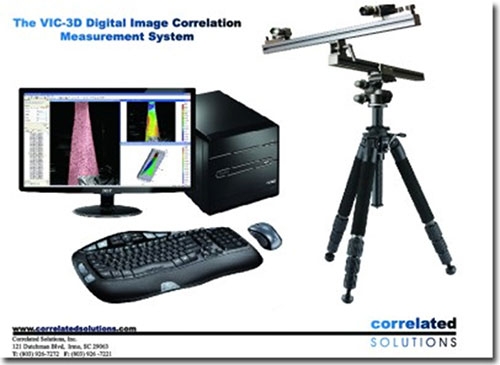
Product Introduction
APIC Corporation is now the official agent for the non-contact strain measurement solutions of Correlated Solutions, Inc. This revolutionary innovation allows you to easily complete the deformation and strain measurement in a short time, because it is not only a single-point measurement, but a one-time 3D measurement, so you can get very accurate results. You no longer need to worry about the size of the object being measured, how to fix the object, or the use of strain gauges and other related instrument peripherals and complicated measurement procedures.
In addition to static measurement, dynamic non-contact strain measurement is also available. The length unit of the object to be measured can range from centimeters (mm) to meters (m), and the time can be as short as nanoseconds (ns). In addition, it also provides measurement solutions such as laser shear measurement and vibration modal analysis. Its measurement system has a wide range of applications, including automotive, aerospace, biomedicine, machinery, electronics, and other related fields. CSI (Correlated Solutions, Inc.) was founded in 1998 and has been committed to the research and development of deformation measurement technology for many years. It is recognized as a leader in digital image correlation technology and is currently the only American company that develops and manufactures 3D image correlation photogrammetry software and hardware systems.
CSI Measurement System Features
- The whole area measurement, not a single point measurement, can easily analyze and identify the deformation and critical points even if the structure is complex and under loading conditions.
- With non-contact measurement, you don’t need to worry about the size of the object being measured or how to fix the object. You also don’t need to use strain gauges or other related equipment.
- The software interface is simple and easy to learn, and users can easily learn and use it.
- The simple test environment uses white light (not laser light) and does not require a darkroom or other specific location. The measurement program can be prepared and started within a short time.


CSI VIC-3D measurement system application
Principle of digital image correlation. Digital image correlation is an optical method for measuring the surface deformation of an object. A subset of the gray value pattern can be tracked during the deformation process. (Highlighted in red in the graphic)
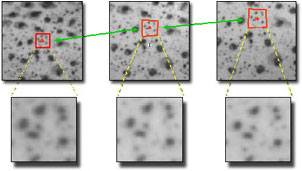
2D Example
Principle of digital image correlation. Digital image correlation is an optical method for measuring the surface deformation of an object. A subset of the gray value pattern can be tracked during the deformation process. (Highlighted in red in the graphic)
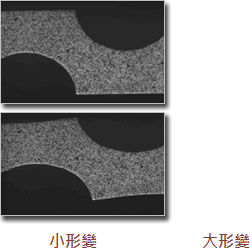
The following is the horizontal strain measured by the 2D image correlation algorithm for the above picture:

3D Examples
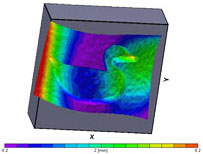
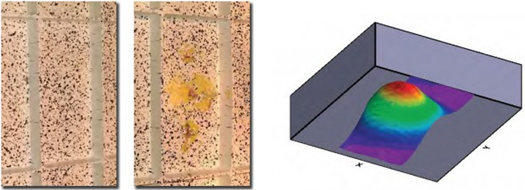
The speckle pattern on the right is captured simultaneously by the left and right cameras of the 3D system. The experimental sample was a piece of paper with a laser-printed speckle pattern to be hung on plexiglass. A second layer of paper cut to shape is glued on top of the first layer.
The shape of the two-layer paper measured using 3D correlation technology shows that the thickness of the paper is approximately 0.0004”
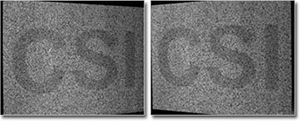
3D Application Examples
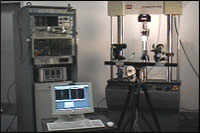
Aluminum Dog-Bone Tension Specimen The image on the left shows the test setup for measuring the dog-bone tension of aluminum using 3D image correlation technology. The Vic-3D system is connected to the test frame's output controller and image-synchronous load data recorder.
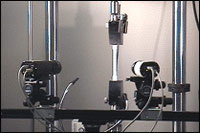
The review image on the right shows the two cameras of the stereo system focused on the sample. The sample is illuminated by a rod-neck style optical fiber that is easily adjusted so the beam illuminates the entire sampl.
Speckle image
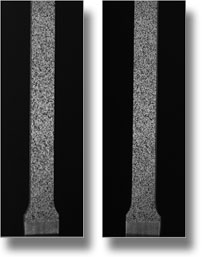
The two pictures on the right are the speckle images of the dog-bone sample in a deformed state captured by the two cameras of the stereo system. The sample shown is 0.5”wide and ”thick. The measurement area is 5”long. This speckle pattern was obtained after applying a coat of paint using a spray can to the aluminum sample. The black speckle was obtained by spraying a black high gloss spray.
Sample necking
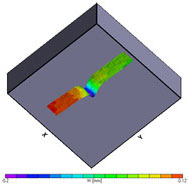
The image on the right shows the out-of-plane displacement with a color code overlaid on the sample to determine failure priority. It shows a typical local necking where failure occurs.
Stress-strain curve
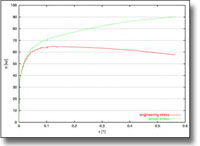
On the right is the stress-strain curve of the sample. The measured strains are averaged over an area corresponding to a gage length of approximately 1/8”. Since Vic-3D computes the Lagrangian strain tensor over the sample surface, the transverse strains can be used to calculate the sample cross-sectional area (using volume conservation constraints). The stress-strain curve on the right shows the reduced cross-sectional area in green.
Automotive Industry:

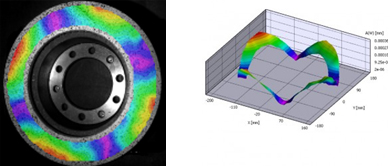
Mechanical industry: Gears

Aerospace: Fuselage structures
Biomedical: Muscle tissue


